以下实例包含折线图与柱状图,设置type: 'bar'是柱状图,设置type: 'line'就是折线图,其实在echarts图表中柱状图和折线图其他地方都是通用的,很好切换,唯一的区别就是type的值不同。
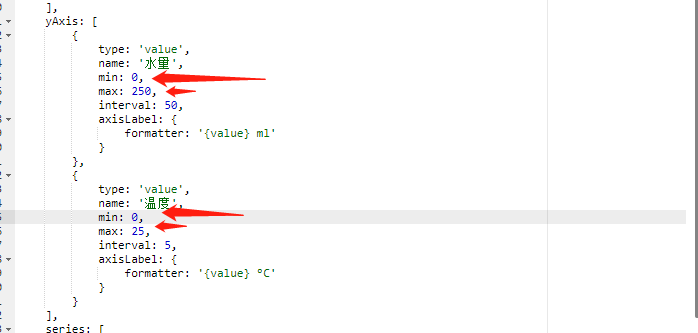
本次案例中遇到设置负数不生效的原因
本次原因为echarts官方示例中的实例设置了min: 0, 意思就是图表中最小值不能低于0,只需要将min: 0, max: 25删掉即可,max代表的是最大值,这两个一般图表中都用不到的,不同的图标案例中min: 0的设置位置可能不同,这没关系,我们找到所有的min删掉。
效果图:
示例代码:
option = {
    tooltip: {
        trigger: 'axis',
        axisPointer: {
            type: 'cross',
            crossStyle: {
                color: '#999'
            }
        }
    },
    toolbox: {
        feature: {
            dataView: {show: true, readOnly: false},
            magicType: {show: true, type: ['line', 'bar']},
            restore: {show: true},
            saveAsImage: {show: true}
        }
    },
    legend: {
        data: ['蒸发量', '降水量', '平均温度']
    },
    xAxis: [
        {
            type: 'category',
            data: ['1月', '2月', '3月', '4月', '5月', '6月', '7月', '8月', '9月', '10月', '11月', '12月'],
            axisPointer: {
                type: 'shadow'
            }
        }
    ],
    yAxis: [
        {
            type: 'value',
            name: '水量',
            interval: 50,
            axisLabel: {
                formatter: '{value} ml'
            }
        },
        {
            type: 'value',
            name: '温度',
            interval: 5,
            axisLabel: {
                formatter: '{value} °C'
            }
        }
    ],
    series: [
        {
            name: '蒸发量',
            type: 'bar',
            data: [-72.0, 4.9, 7.0, 23.2, 25.6, 76.7, 135.6, 162.2, 32.6, 20.0, 6.4, 3.3]
        },
        {
            name: '降水量',
            type: 'bar',
            data: [2.6, 5.9, 9.0, 26.4, 28.7, 70.7, 175.6, 182.2, 48.7, 18.8, 6.0, 2.3]
        },
        {
            name: '平均温度',
            type: 'line',
            yAxisIndex: 1,
            data: [2.0, 2.2, 3.3, 4.5, 6.3, 10.2, 20.3, 23.4, 23.0, 16.5, 12.0, 6.2]
        }
    ]
};


