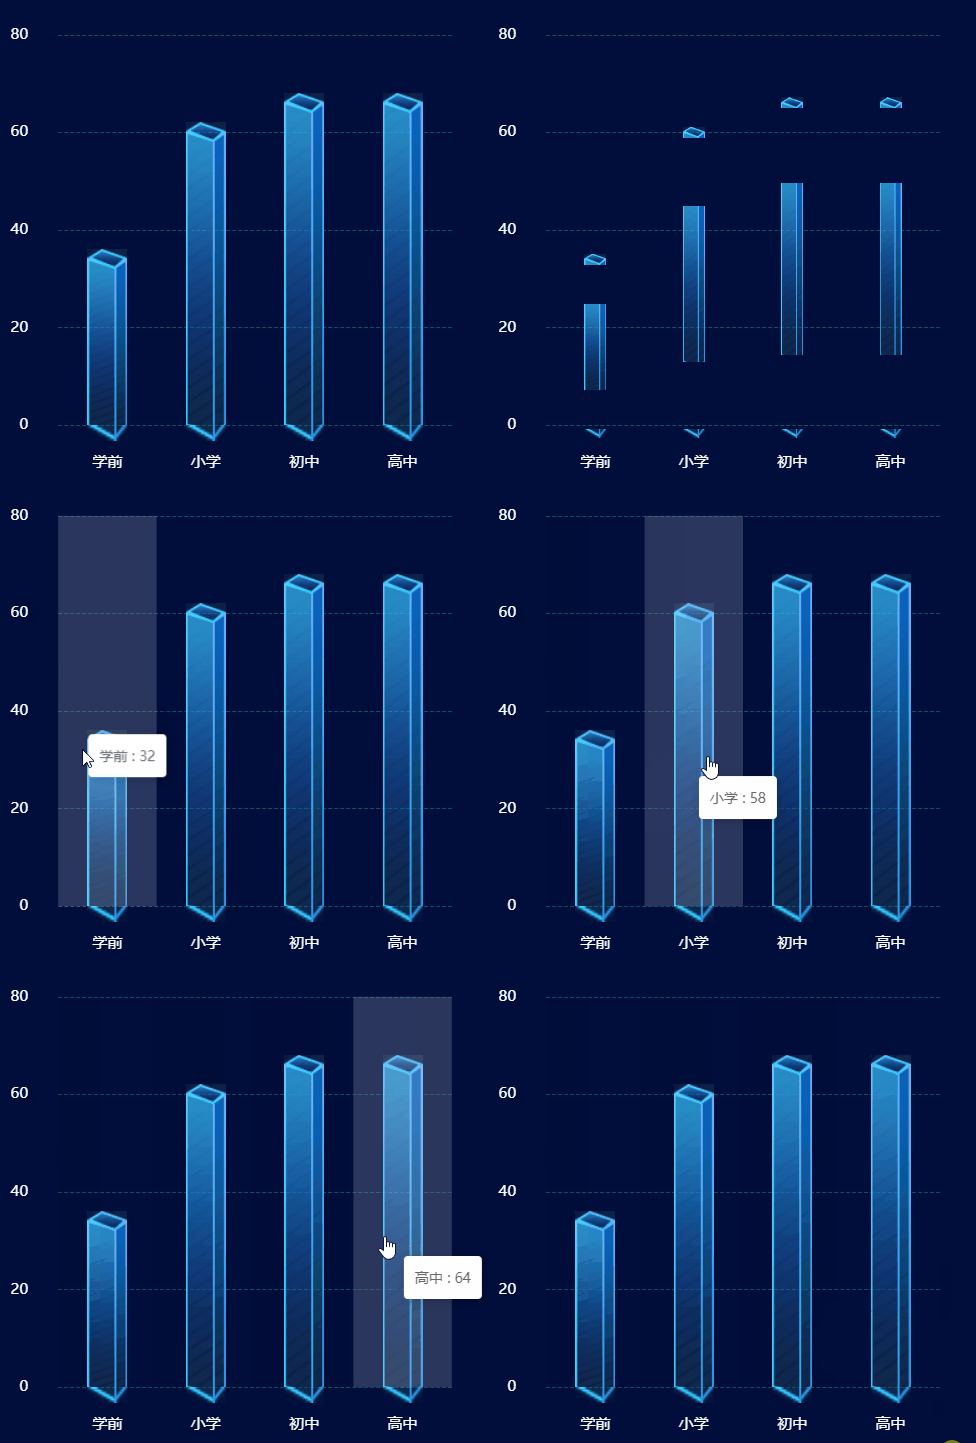
以下方案是echarts柱状图的柱子使用psd切图的方式去还原的案例,由于我们很多人对echarts并没有太过于深度研究,只停留在搬图的层面,即使可以修改,但大屏的echarts柱状图很多都是设计的非常复杂,css很难完美实现,大多只是模仿个差不多,还浪费时间,所以我便想实现通过切图的方式去替换echarts柱状图的柱子,段龙龙博客首发。
效果:

以上图片中的柱子其实是通过切图实现的,为避免图片变形,便将图片分为了上中下三部分,让中间部分高低拉伸,上下部分拼接补位即可。
实例: 图片可使用网络地址与base64流,图片生成base64格式工具,图片路径前要加上image:// 哦,段龙龙博客首发。。
let yList = [32, 58, 64, 64, ];
let xList = [10, 55, 44, 55, ];
let xData = ['学前', '小学', '初中', '高中'];
let color = ['#CC1CAA', '#8D67FF', '#00FFFF', '#48DE13', '#FFC516', '#DC3E14', '#8E16F8'];

dom = 800;
barWidth = dom / 20;
option = {
    backgroundColor: "#010d3a",
    //提示框
    tooltip: {
        trigger: 'axis',
        formatter: "{b} : {c}",
        axisPointer: { // 坐标轴指示器,坐标轴触发有效
            type: 'shadow' // 默认为直线,可选为:'line' | 'shadow'
        }
    },
    /**区域位置*/
      grid: {
          left: '10%',
          right: '10%',
          top: '10%',
          bottom: '10%',
        },
    //X轴
    xAxis: {
        data: xData,
        type: 'category',
        axisLine: {
            show: false,
            lineStyle: {
                color: 'rgba(255,255,255,1)',
                shadowColor: 'rgba(255,255,255,1)',
                shadowOffsetX: '20',
            },
            symbol: ['none', 'arrow'],
            symbolOffset: [0, 25]
        },
        splitLine: {
            show: false,
        },
        axisTick: {
            show: false, //X轴刻度不显示
        },
        axisLabel: {// X间距与字体大小设置
            margin: 30,
            fontSize: 15,
        },
    },
    yAxis: {
        show: true,
        splitNumber: 4,
        axisLine: {
            show: false,
        },
        splitLine: {  // 图表内横线样式
            show: true,
            lineStyle: {
                type:'dashed',
                color: '#075858'
            },
        },
        axisLabel: {
            color: '#FFFFFF',
            margin: 30,
            fontSize:15
        }
    },
    series: [
        {
            type: 'bar',
            itemStyle: {
                normal: { //默认柱子消失
                    color: function(params) {
                        return;
                    }
                }
            },
            label: {
                show: false,// 柱子上不显示数字
            },
            data: yList
        },
        { // 底部部分图片
            z: 2,
            type: 'pictorialBar',
            data: yList,
            symbol: 'image://' + '图片路径base64或网络地址',
            symbolOffset: [0, '100%'],
            symbolSize: [barWidth, barWidth * 0.4],
        },
        {
            z: 5, //中间部分图片
            type: 'pictorialBar',
            data: yList,
            symbol: 'image://' + '图片路径base64或网络地址',
            symbolSize: [barWidth,'100%'],
        },
        {
            z: 4, //头部图片
            type: 'pictorialBar',
            symbolPosition: 'end',
            data: yList,
            symbol: 'image://' + '图片路径base64或网络地址',
            symbolOffset: [0, '-100%'],
            symbolSize: [barWidth, barWidth * 0.5],
        },
    ],
};
下载包含base64图片案例:
